Published in JMLR · 2026 · 27(229)

COAT / Causal Representation Assistant

Discover variables
in unstructured data.

You have reviews and ratings, or images and diagnoses. COAT helps identify attributes to measure so you can analyze more than the variables already in your table.

Language models propose and measure candidate factors. Statistical feedback guides further discovery, causal-structure analysis and effect estimation.

The Python package provides text-based discovery interfaces. The paper also studies images and tool-based measurements.

One review, three measured attributes
“Very sweet apples, a rich aroma, but rather small.”

Define what each attribute means, then apply the rule to every review.

SweetnessVery sweet
AromaStrong
SizeSmall
Illustrative categories. The example below introduces numeric encoding.

Examples

From observations
to measured factors.

A factor is an attribute with a definition and measurement rule. Here sweetness has three levels: 0 for not sweet, 1 for mildly sweet and 2 for very sweet. Each review receives a value under the same rule.

Preset teaching example

Observation

Rating: 5/5
A rich apple aroma, very sweet taste, and small apples that fit in my lunch box.

Measurement rule

Sweetness

2

Sweetness explicitly described in a review.

0
Explicitly not sweet
1
Mildly sweet
2
Very sweet

The highlighted passage supports this level under the displayed rule.

Inspect the measurement table

Select a value to inspect its observation and rule. Try R03, then select Aroma: the review says nothing about aroma, so its value is missing rather than zero.

One rule across observations makes a column.
SampleSweetnessAromaSize
R01
R02
R03

Observation

Paired target: diagnosis class
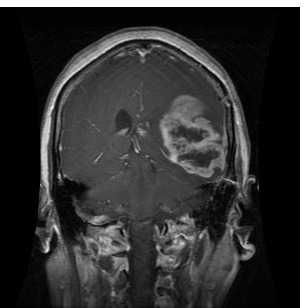
Image crops come from the paper. Boxes and assignments are teaching cues, not segmentation, automated localization or clinical labels.

Measurement rule

Local brightness

1

A visual attribute in a specified observation region.

0
No clear local bright area
1
A marked local bright area

Image crops come from the paper. Boxes and assignments are teaching cues, not segmentation, automated localization or clinical labels.

Inspect the measurement table

Select a value to inspect its observation and rule.

One rule across observations makes a column.
SampleLocal brightnessShape difference
M01
M02

Observation

Illustrative news, not a real report
The company announced a new cloud technology platform and described its research team's work.

Measurement rule

Technical progress

1

Distinguish routine maintenance from a new technical development.

0
Routine maintenance
1
A new technology or technical breakthrough

The highlighted passage supports this level under the displayed rule.

Inspect the measurement table

Select a value to inspect its observation and rule.

One rule across observations makes a column.
SampleTechnical progressMarket expansion
N01
N02

A tool-based factor specifies what to read, where to read it and how to aggregate it. The code defines measurement; the model does not guess a temperature.

Quantity
Near-surface air temperature
Region
Niño3 · 5°S–5°N, 150°W–90°W

Measurement definition / illustrative Python

field = archive["air_temperature"].sel(
    latitude=slice(-5, 5),
    longitude=slice(210, 270),
)
factor = field.mean(("latitude", "longitude"))
Niño3 region in the tropical Pacific; map base from Natural Earth, with no observed climate data.Niño3
Niño3 region in the tropical Pacific; map base from Natural Earth, with no observed climate data.
One value for each month / °C
JanFebMarAprMayJun
26.827.227.928.227.727.4

Preset teaching values, not live reanalysis. The code is illustrative, not a coatlearn database API. Real measurements need the data product's weighting and quality controls.

These teaching tables use selected levels to explain encoding. In the package, score values are probability-weighted averages of the declared levels; probabilities and confidence are separate metadata.

Teaching examples with preset values. Text highlights and image boxes are hand-authored observation cues, not evidence returned by the package. No model runs in this page. The paper explores text, images and tool-based measurements. The ready-to-use Python discovery interfaces take text columns; the image and climate examples illustrate the broader framework.

How COAT works

Statistical feedback guides
the next factor proposal.

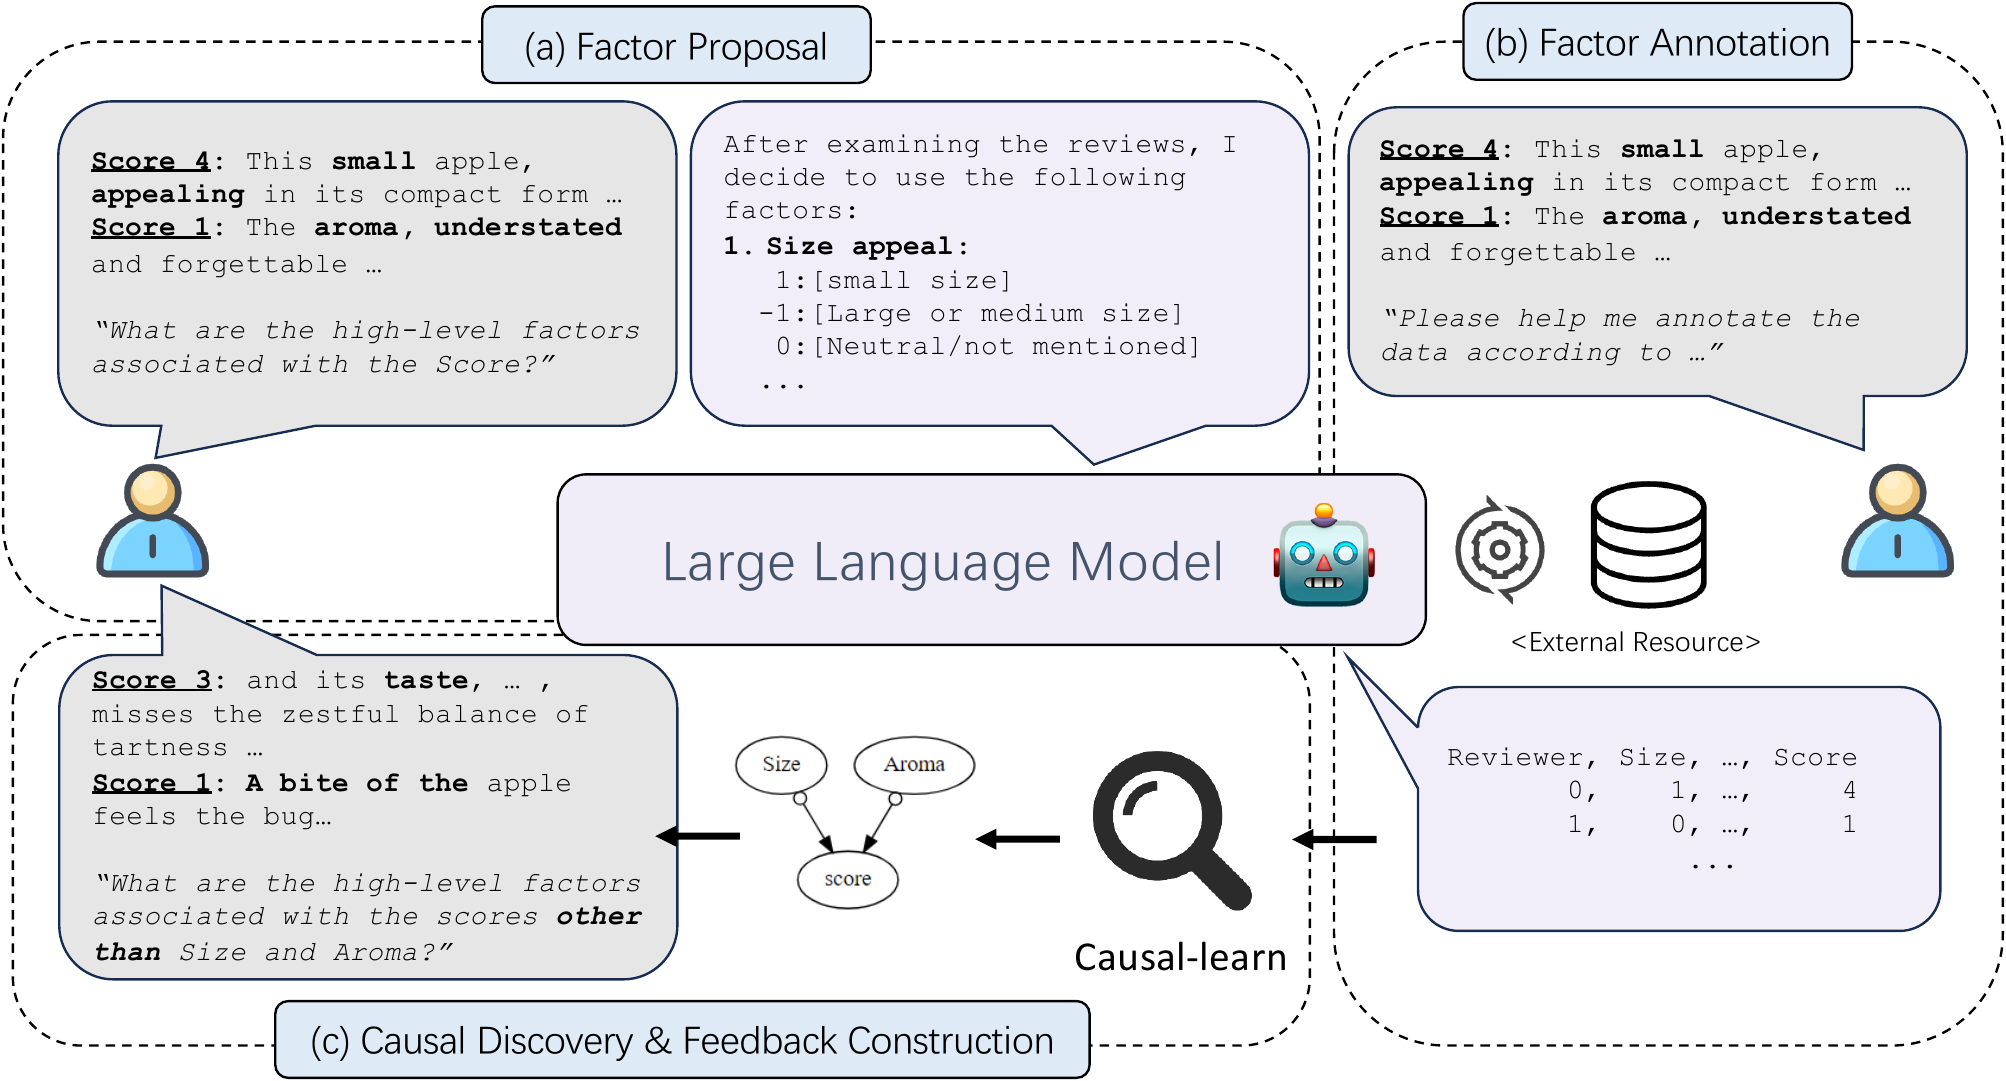
Knowing how to measure a factor does not tell you which factors you are missing. COAT links model-generated candidates with statistical analysis in a feedback loop.

  1. 01

    Propose

    A chat model reads selected observations and defines candidate factors.

  2. 02

    Measure

    An annotation model applies the same definitions across observations.

  3. 03

    Assess

    Conditional-independence tests ask what information remains after other variables are considered.

  4. 04

    Refine

    Statistical feedback directs the next proposal toward information the current factors leave unexplained.

Models interpret and measure. Statistical methods assess structure under assumptions.

View the paper's framework figure
Paper figure showing factor proposal, annotation, statistical causal discovery and feedback.

Analysis goals

Choose the result
your question needs.

These are different goals. A useful predictor is not necessarily a cause, and an association is not the effect of taking an action.

COAT-MB

Which attributes jointly inform a rating?

Markov blanket

A set that leaves other candidates with no extra target information once the set is given. Useful for later prediction and investigation; it can include effects as well as causes.

Input
One numeric target + paired text.
Output
Factor definitions and a selected set.
View inputs and Python interface
COAT-PAG

What structure connects my variables?

Partial ancestral graph

A graph representing structures that share conditional independencies. Adding factors can refine its endpoints; circles retain unresolved directions.

Input
Existing numeric variables + paired text.
Output
An expanded variable set and a PAG.
View inputs and Python interface
COAT-ADJ

How much would an action change an outcome?

Adjustment sets and effect estimates

Seek variables that permit covariate adjustment under the graph and assumptions, then estimate the average treatment effect with inverse probability weighting.

Input
A 0/1 treatment, numeric outcome + paired text.
Output
A graph, adjustment sets and per-set estimates when supported.
View inputs and Python interface

Already know the factors? Annotate them directly. Already have measurements and a graph? Analyze them without another model call.

Annotate existing factorsAnalyze an existing graph

Get started

Find factors in
1,000 apple reviews.

The supplied MB task uses Score and Review, allows five discovery rounds and records factor definitions with the selected set. Begin by inspecting its local configuration.

Prepare your analysis environment

Use Python 3.11 or newer and install from PyPI. The installation guide prepares a small example directory with configuration and data; no repository clone or local GPU is needed for hosted models.

Installation and configuration setup

1. Install coatlearn

python -m pip install coatlearn
python -m coatlearn --help

Installation starts no models. Follow the installation guide to download config/ and data/ into coat-example, then inspect the MB task without --run before execution.

Run from the prepared coat-example directory. This uses DeepSeek Flash to propose factors and hosted Jev to annotate and check definitions. Prepare DEEPSEEK_API_KEY and TYPESAFE_API_KEY first. Text is sent to those providers and calls may incur charges. Local Kev is an alternative.

Prepare model credentials

2. Connect models and run

python -m coatlearn mb --config config/mb.toml --decision-model jev \
  --run --output-dir runs/apple-mb

3. Read the selected variables

import json
from pathlib import Path

result = json.loads(
    Path("runs/apple-mb/result.json").read_text()
)
print(result["diagnostics"]["final_blanket"])

The list also includes the target Score. Factor definitions, settings and assumptions are saved with the result.

Follow the full tutorial

MB and PAG share 1,000 synthetic apple reviews. ADJ uses 2,000 synthetic customer posts in a confounded email/visit study, not the original randomized Hillstrom table.

Available on PyPI as coatlearn. Software: Apache-2.0. The two example CSV files: CC BY 4.0, with attribution. Source repository

Research cases

Climate measurements
and news factors.

The paper explores how new measured factors can sharpen a research question. These studies use additional domain-specific setups, not one-click package demos.

Climate / ENSO

Which factors relate to next month's sea-temperature change?

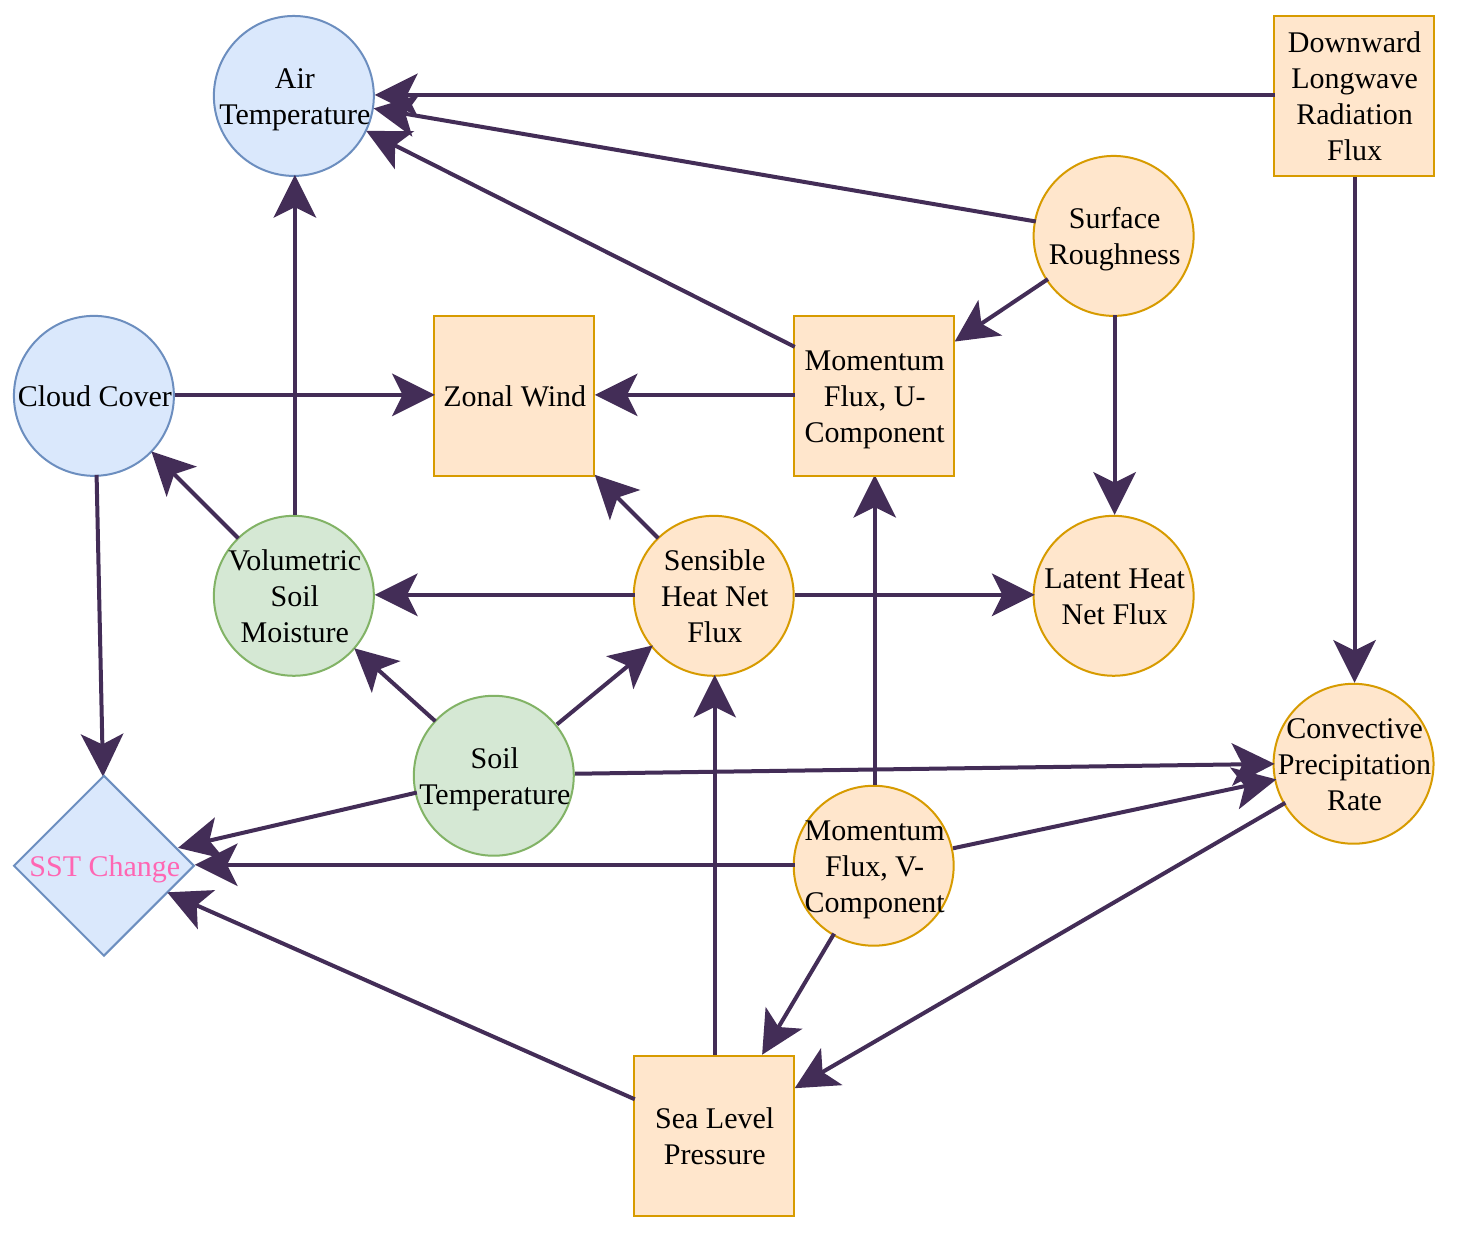
A tool-using model defines regional measurements in NOAA reanalysis data. The study elicits 13 factors, recovers literature-consistent relationships and proposes a soil-temperature hypothesis for further investigation.

View the published graph
Paper ENSO graph with 13 climate factors and a sea-temperature-change target.
Read the JMLR paper

News / Microsoft

Which parts of news inform future returns?

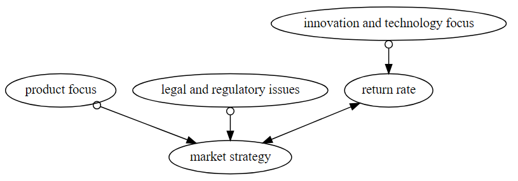
The study separates innovation, product, legal and strategic information. Factors discovered in the first 200 trading days are examined with strategies on the following 400 days, in one historical stock setting.

View the published graph
Paper graph showing four news factors and return rate.
Read the JMLR paper

Causal conclusions depend on measurement, data and method assumptions. A completed run does not establish those assumptions; a missing estimate is not a zero effect.

The published work

Discovering and Reasoning of Causality in the Hidden World with Large Language Models

Chenxi Liu · Yongqiang Chen · Tongliang Liu · Mingming Gong · James Cheng · Bo Han · Kun Zhang

Chenxi Liu and Yongqiang Chen contributed equally. Corresponding author: Bo Han.

Journal of Machine Learning Research
27(229):1–95, 2026

The journal extension adds COAT-PAG, COAT-ADJ and their identifiability analysis to the NeurIPS 2024 framework.

Citation / official JMLR BibTeX
@article{JMLR:v27:25-2137,
  author  = {Chenxi Liu and Yongqiang Chen and Tongliang Liu and Mingming Gong and James Cheng and Bo Han and Kun Zhang},
  title   = {Discovering and Reasoning of Causality in the Hidden World with Large Language Models},
  journal = {Journal of Machine Learning Research},
  year    = {2026},
  volume  = {27},
  number  = {229},
  pages   = {1--95},
  url     = {http://jmlr.org/papers/v27/25-2137.html}
}